ISO-NE produces weekly analysis of estimated impact of COVID-19 on consumer demand
 Since mid-March, ISO New England has observed an impact on consumer demand for electricity attributable to societal changes in response to the COVID-19 pandemic. Overall, consumer demand has declined by 3 to 5% compared to what ISO forecasters would otherwise have expected, though these percentages have and will continue to fluctuate from week to week.
In an effort to share what our system operators are seeing with stakeholders and the public, ISO New England is producing a weekly analysis of the impact the response to COVID-19 is having on regionwide system demand. Updated information for this analysis will be posted to the ISO New England website every Tuesday for the foreseeable future.
This article details the different charts included in this analysis, and can serve as a reference for those looking to follow the data in the coming weeks and months.
Establishing a baseline
Every day, ISO forecasters use nearly a dozen forecast models, each honed to different sensitivities, to put together a 24-hour forecast of consumer demand for the region. These models are fed information on what actual consumer demand is under different conditions, and over time will learn to account for system changes and trends.
As pandemic response measures began to take effect, in an effort to determine the impacts of COVID-19, ISO forecasters decided to stop providing new information to one model. Essentially, this model would not know the pandemic was happening and, thus, would forecast consumer demand as if the pandemic had never happened. This gives forecasters a baseline of what consumer demand would have been without the pandemic response measures. By using actual weather in place of forecasted weather, this model can now be referred to in the analysis as the backcast, removing uncertainties introduced by weather volatility. This backcast can then be compared to actual consumer demand.
Weekly analysis
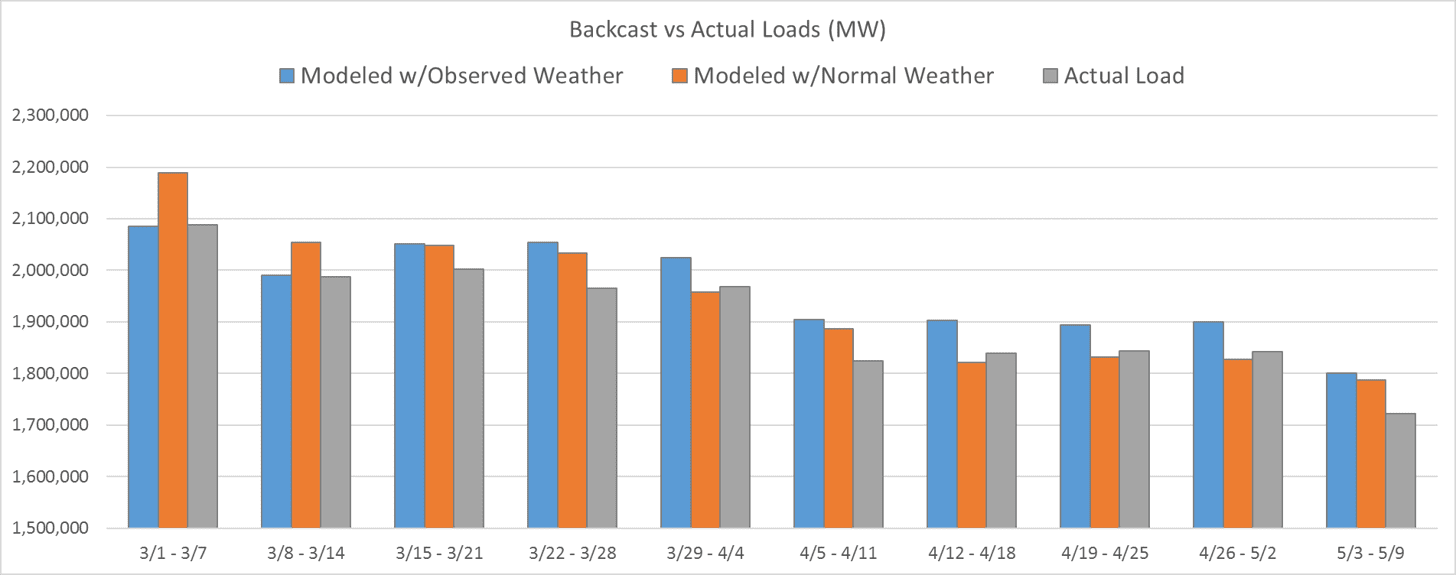
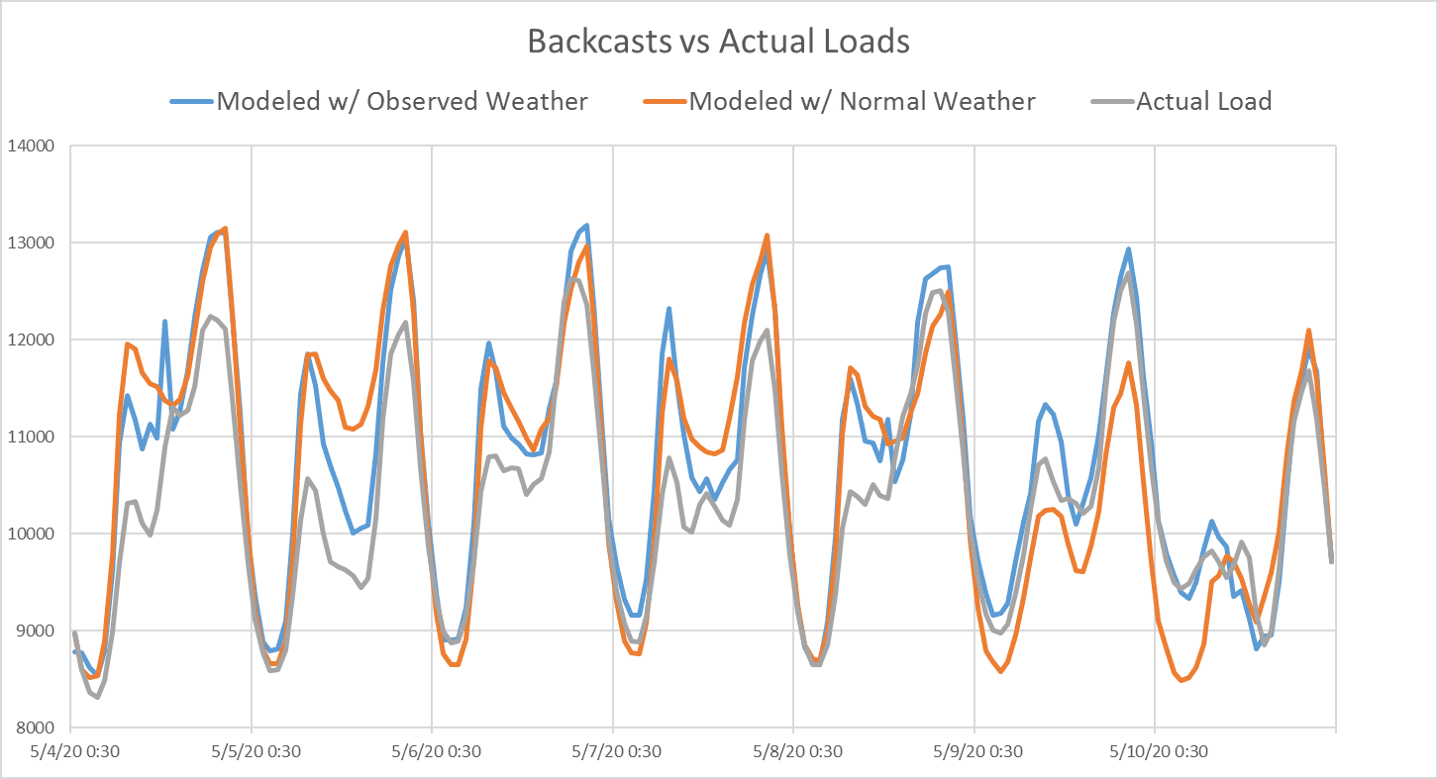
The first chart in the weekly analysis, provided below, shows the differences between the backcast and actual loads. The blue columns show what the backcast projects consumer demand would be under actual observed weather conditions in New England absent COVID, while the orange columns show what demand would have been under normal weather conditions absent COVID, based on 10-year averages of weather data. The gray column shows actual consumer demand in New England.
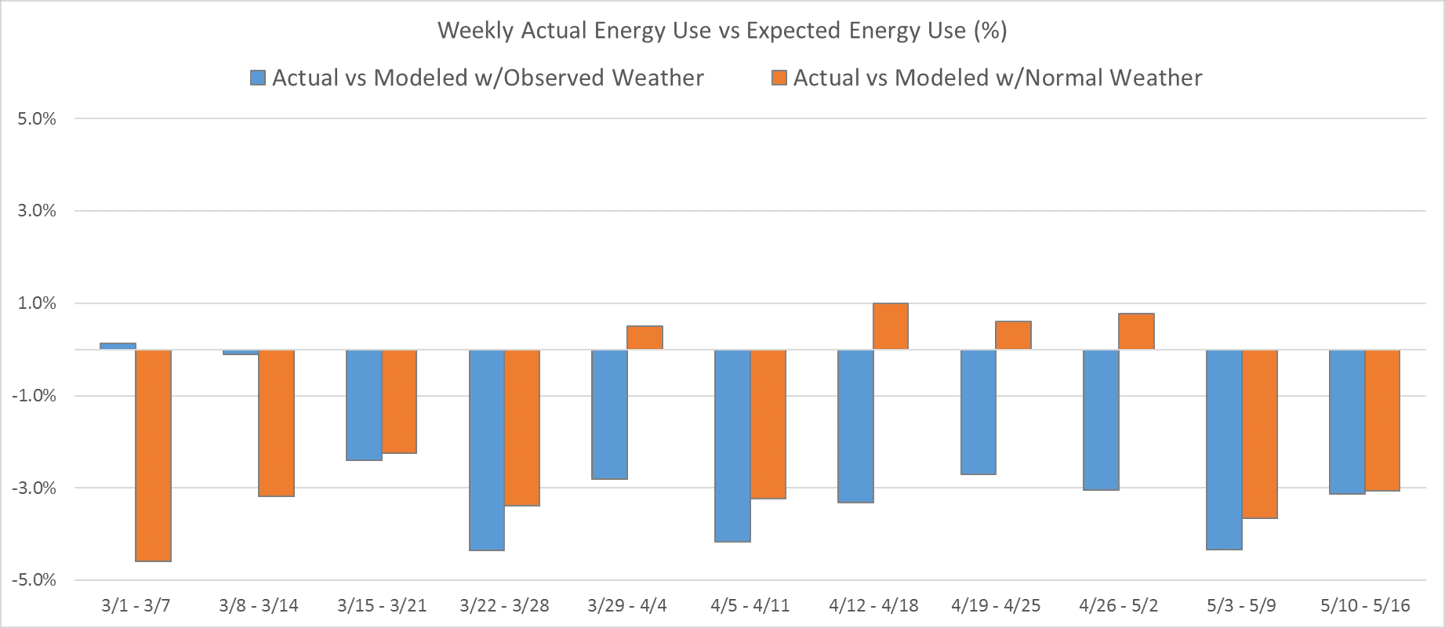
The next chart shows the percentage difference in energy use between modeled and actual demand, charted weekly from Sunday to Saturday, for both actual and normal weather, as described above.
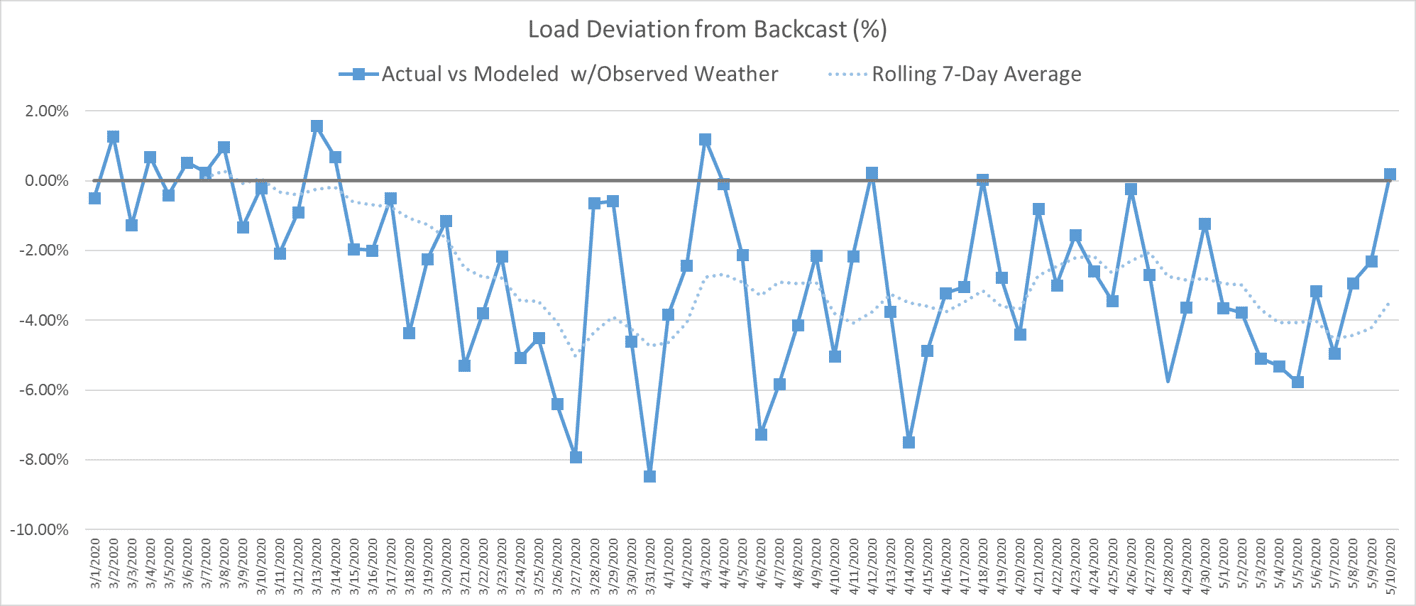
The chart below shows the percentage deviation between daily actual average hourly demand and what the backcast model would have expected under observed weather conditions. This chart is the basis for the above assertion that load is 3 to 5% lower than expected.
The next chart displays backcast and actual demand information in the form of daily load curves, running from Monday to Sunday of the previous week. Actual consumer demand (gray) is compared to the backcast modeled demand under actual and normal weather conditions. This chart demonstrates the variability of expected and actual demand across different hours and days of the week.
For further updates on the impact of COVID-19 on ISO New England and the regional power system, visit www.isonewswire.com/covid-19.
- Categories
- Industry News & Developments
- Tags
- covid-19, forecast, system operations